绘制K线图。
用法示例
注意示例需要在notebook中运行,否则无法生成图。
1 2 3 4 5 | |
这将生成下图:
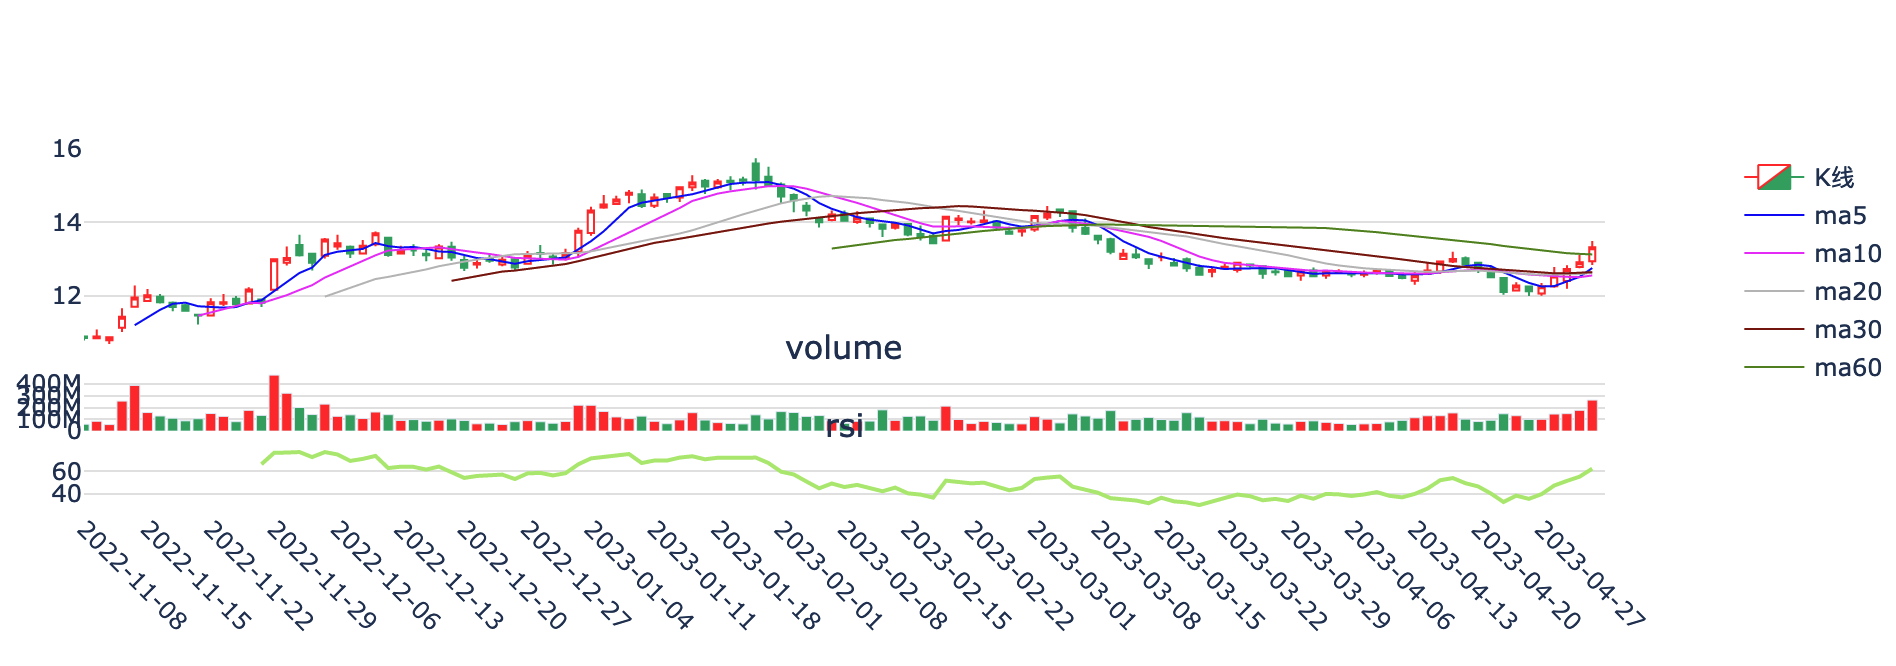
默认地,将显示成交量和RSI指标两个副图。可以通过以下方式来定制:
1 2 3 4 5 | |
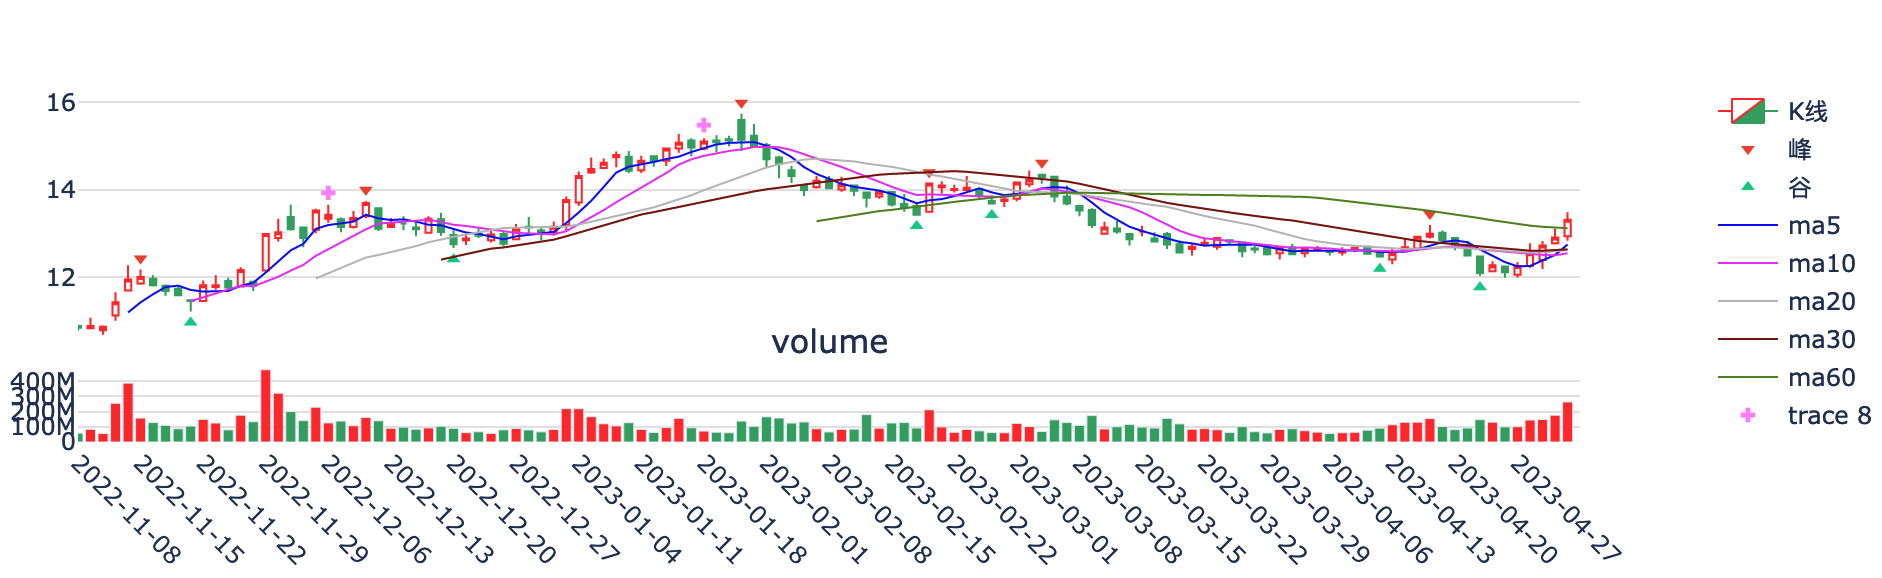
增加标记
1 2 3 4 5 6 7 8 9 10 11 | |
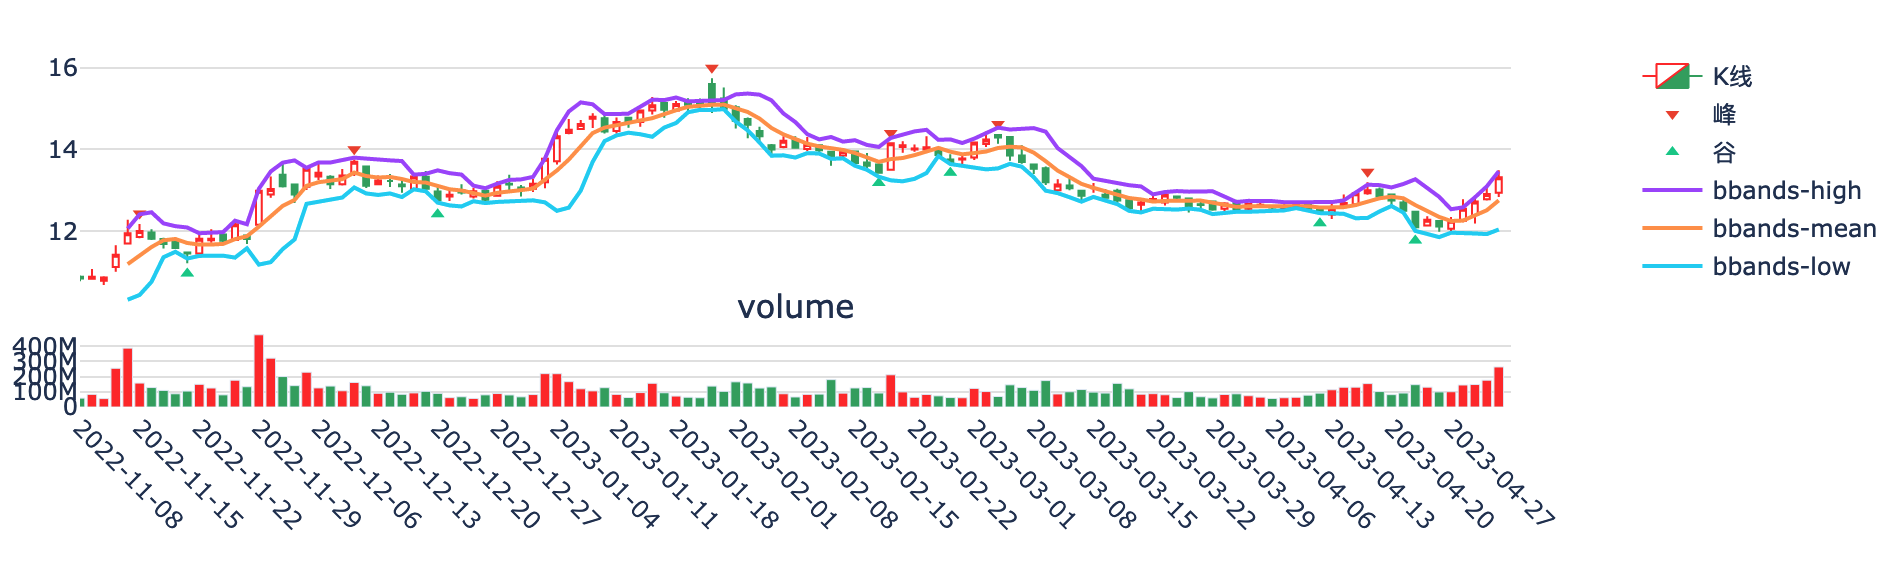
显示布林带
1 2 3 4 5 6 7 8 9 10 11 | |
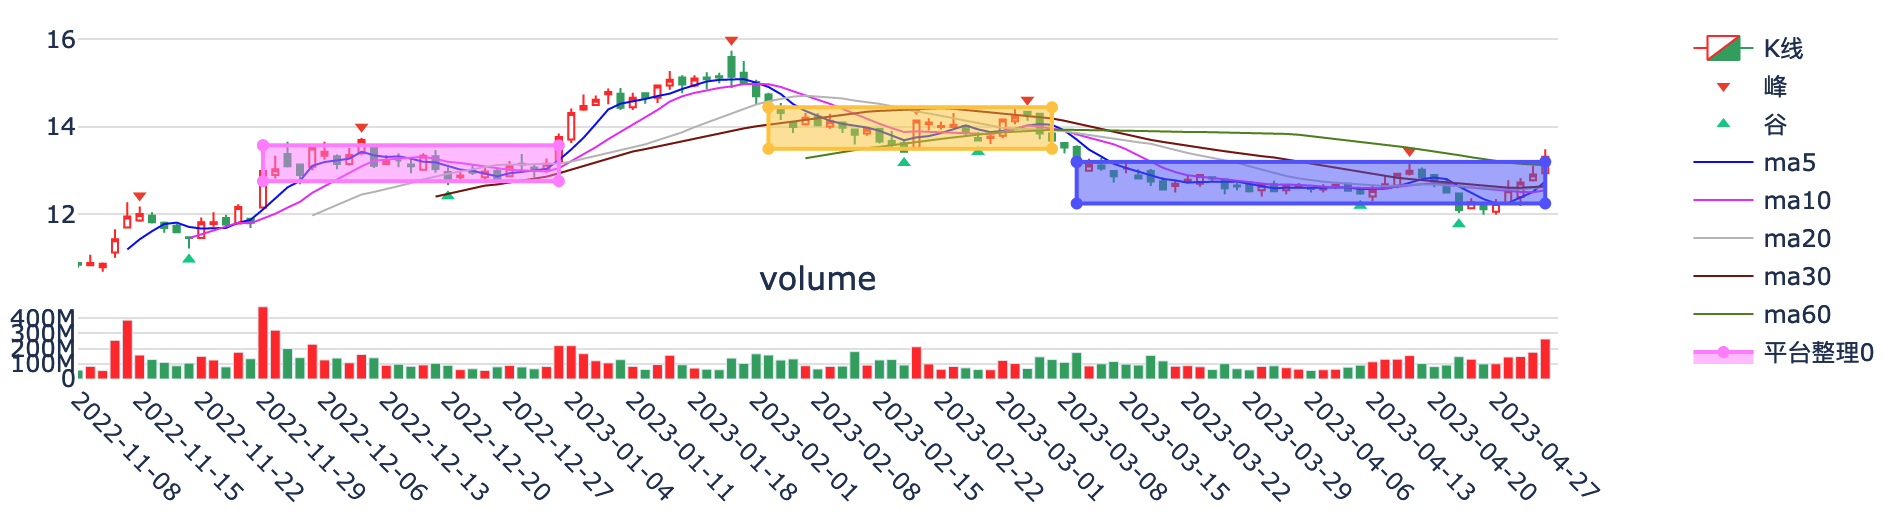
显示平台
1 2 3 4 5 6 7 8 9 10 11 12 | |
Candlestick
Source code in omicron/plotting/candlestick.py
class Candlestick:
    RED = "#FF4136"
    GREEN = "#3DAA70"
    TRANSPARENT = "rgba(0,0,0,0)"
    LIGHT_GRAY = "rgba(0, 0, 0, 0.1)"
    MA_COLORS = {
        5: "#1432F5",
        10: "#EB52F7",
        20: "#C0C0C0",
        30: "#882111",
        60: "#5E8E28",
        120: "#4294F7",
        250: "#F09937",
    }

    def __init__(
        self,
        bars: np.ndarray,
        ma_groups: List[int] = None,
        win_size: int = 120,
        title: str = None,
        show_volume=True,
        show_rsi=True,
        show_peaks=False,
        **kwargs,
    ):
        """构造函数

        Args:
            bars: 行情数据
            ma_groups: 均线组参数。比如[5, 10, 20]表明向k线图中添加5, 10, 20日均线。如果不提供,将从数组[5, 10, 20, 30, 60, 120, 250]中取直到与`len(bars) - 5`匹配的参数为止。比如bars长度为30,则将取[5, 10, 20]来绘制均线。
            win_size: 缺省绘制多少个bar,超出部分将不显示。
            title: k线图的标题
            show_volume: 是否显示成交量图
            show_rsi: 是否显示RSI图。缺省显示参数为6的RSI图。
            show_peaks: 是否标记检测出来的峰跟谷。
        kwargs:
            rsi_win: default is 6
        """
        self.title = title
        self.bars = bars
        self.win_size = win_size

        # traces for main area
        self.main_traces = {}

        # traces for indicator area
        self.ind_traces = {}

        self.ticks = self._format_tick(bars["frame"])
        self._bar_close = array_math_round(bars["close"], 2).astype(np.float64)

        # for every candlestick, it must contain a candlestick plot
        cs = go.Candlestick(
            x=self.ticks,
            open=bars["open"],
            high=bars["high"],
            low=bars["low"],
            close=self._bar_close,
            line=dict({"width": 1}),
            name="K线",
            **kwargs,
        )

        # Set line and fill colors
        cs.increasing.fillcolor = "rgba(255,255,255,0.9)"
        cs.increasing.line.color = self.RED
        cs.decreasing.fillcolor = self.GREEN
        cs.decreasing.line.color = self.GREEN

        self.main_traces["ohlc"] = cs

        if show_volume:
            self.add_indicator("volume")

        if show_peaks:
            self.add_main_trace("peaks")

        if show_rsi:
            self.add_indicator("rsi", win=kwargs.get("rsi_win", 6))

        # 增加均线
        if ma_groups is None:
            nbars = len(bars)
            if nbars < 9:
                ma_groups = []
            else:
                groups = np.array([5, 10, 20, 30, 60, 120, 250])
                idx = max(np.argwhere(groups < (nbars - 5))).item() + 1
                ma_groups = groups[:idx]

        for win in ma_groups:
            name = f"ma{win}"
            if win > len(bars):
                continue
            ma = moving_average(self._bar_close, win)
            line = go.Scatter(
                y=ma,
                x=self.ticks,
                name=name,
                line=dict(width=1, color=self.MA_COLORS.get(win)),
            )
            self.main_traces[name] = line

    @property
    def figure(self):
        """返回一个figure对象"""
        rows = len(self.ind_traces) + 1
        specs = [[{"secondary_y": False}]] * rows
        specs[0][0]["secondary_y"] = True

        row_heights = [0.7, *([0.2] * (rows - 1))]
        cols = 1

        fig = make_subplots(
            rows=rows,
            cols=cols,
            shared_xaxes=True,
            vertical_spacing=0.1,
            subplot_titles=(self.title, *self.ind_traces.keys()),
            row_heights=row_heights,
            specs=specs,
        )

        for _, trace in self.main_traces.items():
            fig.add_trace(trace, row=1, col=1)

        for i, (_, trace) in enumerate(self.ind_traces.items()):
            fig.add_trace(trace, row=i + 2, col=1)

        fig.update(layout_xaxis_rangeslider_visible=False)
        fig.update_yaxes(showgrid=True, gridcolor=self.LIGHT_GRAY)
        fig.update_layout(plot_bgcolor=self.TRANSPARENT)
        fig.update_xaxes(type="category", tickangle=45, nticks=len(self.ticks) // 5)
        end = len(self.ticks)
        start = end - self.win_size
        fig.update_xaxes(range=[start, end])

        return fig

    def _format_tick(self, tm: np.array) -> NDArray:
        if tm.item(0).hour == 0:  # assume it's date
            return np.array(
                [
                    f"{x.item().year:02}-{x.item().month:02}-{x.item().day:02}"
                    for x in tm
                ]
            )
        else:
            return np.array(
                [
                    f"{x.item().month:02}-{x.item().day:02} {x.item().hour:02}:{x.item().minute:02}"
                    for x in tm
                ]
            )

    def _remove_ma(self):
        traces = {}
        for name in self.main_traces:
            if not name.startswith("ma"):
                traces[name] = self.main_traces[name]

        self.main_traces = traces

    def add_main_trace(self, trace_name: str, **kwargs):
        """add trace to main plot

        支持的图例类别有peaks, bbox(bounding-box), bt(回测), support_line, resist_line
        Args:
            trace_name : 图例名称
            **kwargs : 其他参数

        """
        if trace_name == "peaks":
            self.mark_peaks_and_valleys(
                kwargs.get("up_thres", 0.03), kwargs.get("down_thres", -0.03)
            )

        # 标注矩形框
        elif trace_name == "bbox":
            self.add_bounding_box(kwargs.get("boxes"))

        # 回测结果
        elif trace_name == "bt":
            self.add_backtest_result(kwargs.get("bt"))

        # 增加直线
        elif trace_name == "support_line":
            self.add_line("支撑线", kwargs.get("x"), kwargs.get("y"))

        elif trace_name == "resist_line":
            self.add_line("压力线", kwargs.get("x"), kwargs.get("y"))

    def add_line(self, trace_name: str, x: List[int], y: List[float]):
        """在k线图上增加以`x`,`y`表示的一条直线

        Args:
            trace_name : 图例名称
            x : x轴坐标,所有的x值都必须属于[0, len(self.bars)]
            y : y值
        """
        line = go.Scatter(x=self.ticks[x], y=y, mode="lines", name=trace_name)

        self.main_traces[trace_name] = line

    def mark_support_resist_lines(
        self, upthres: float = None, downthres: float = None, use_close=True, win=60
    ):
        """在K线图上标注支撑线和压力线

        在`win`个k线内,找出所有的局部峰谷点,并以最高的两个峰连线生成压力线,以最低的两个谷连线生成支撑线。

        Args:
            upthres : 用来检测峰谷时使用的阈值,参见`omicron.talib.morph.peaks_and_valleys`
            downthres : 用来检测峰谷时使用的阈值,参见`omicron.talib.morph.peaks_and_valleys`.
            use_close : 是否使用收盘价来进行检测。如果为False,则使用high来检测压力线,使用low来检测支撑线.
            win : 检测局部高低点的窗口.
        """
        bars = self.bars[-win:]
        clipped = len(self.bars) - win

        if use_close:
            support, resist, x_start = support_resist_lines(
                self._bar_close, upthres, downthres
            )
            x = np.arange(len(bars))[x_start:]

            self.add_main_trace("support_line", x=x + clipped, y=support(x))
            self.add_main_trace("resist_line", x=x + clipped, y=resist(x))

        else:  # 使用"high"和"low"
            bars = self.bars[-win:]
            support, _, x_start = support_resist_lines(bars["low"], upthres, downthres)
            x = np.arange(len(bars))[x_start:]
            self.add_main_trace("support_line", x=x + clipped, y=support(x))

            _, resist, x_start = support_resist_lines(bars["high"], upthres, downthres)
            x = np.arange(len(bars))[x_start:]
            self.add_main_trace("resist_line", x=x + clipped, y=resist(x))

    def mark_bbox(self, min_size: int = 20):
        """在k线图上检测并标注矩形框

        Args:
            min_size : 矩形框的最小长度

        """
        boxes = plateaus(self._bar_close, min_size)
        self.add_main_trace("bbox", boxes=boxes)

    def mark_backtest_result(self, result: dict):
        """标记买卖点和回测数据

        TODO:
            此方法可能未与backtest返回值同步。此外,在portofolio回测中,不可能在k线图中使用此方法。

        Args:
            points : 买卖点的坐标。
        """
        trades = result.get("trades")
        assets = result.get("assets")

        x, y, labels = [], [], []
        hover = []
        labels_color = defaultdict(list)

        for trade in trades:
            trade_date = arrow.get(trade["time"]).date()
            asset = assets.get(trade_date)

            security = trade["security"]
            price = trade["price"]
            volume = trade["volume"]

            side = trade["order_side"]

            x.append(self._format_tick(trade_date))

            bar = self.bars[self.bars["frame"] == trade_date]
            if side == "买入":
                hover.append(
                    f"总资产:{asset}<br><br>{side}:{security}<br>买入价:{price}<br>股数:{volume}"
                )

                y.append(bar["high"][0] * 1.1)
                labels.append("B")
                labels_color["color"].append(self.RED)

            else:
                y.append(bar["low"][0] * 0.99)

                hover.append(
                    f"总资产:{asset}<hr><br>{side}:{security}<br>卖出价:{price}<br>股数:{volume}"
                )

                labels.append("S")
                labels_color["color"].append(self.GREEN)

                labels_color.append(self.GREEN)
                # txt.append(f'{side}:{security}<br>卖出价:{price}<br>股数:{volume}')

        trace = go.Scatter(
            x=x,
            y=y,
            mode="text",
            text=labels,
            name="backtest",
            hovertext=hover,
            textfont=labels_color,
        )

        self.main_traces["bs"] = trace

    def mark_peaks_and_valleys(
        self, up_thres: Optional[float] = None, down_thres: Optional[float] = None
    ):
        """在K线图上标注峰谷点

        Args:
            up_thres : 用来检测峰谷时使用的阈值,参见[omicron.talib.morph.peaks_and_valleys][]
            down_thres : 用来检测峰谷时使用的阈值,参见[omicron.talib.morph.peaks_and_valleys][]

        """
        bars = self.bars

        flags = peaks_and_valleys(self._bar_close, up_thres, down_thres)

        # 移除首尾的顶底标记,一般情况下它们都不是真正的顶和底。
        flags[0] = 0
        flags[-1] = 0

        marker_margin = (max(bars["high"]) - min(bars["low"])) * 0.05
        ticks_up = self.ticks[flags == 1]
        y_up = bars["high"][flags == 1] + marker_margin
        ticks_down = self.ticks[flags == -1]
        y_down = bars["low"][flags == -1] - marker_margin

        trace = go.Scatter(
            mode="markers", x=ticks_up, y=y_up, marker_symbol="triangle-down", name="峰"
        )
        self.main_traces["peaks"] = trace

        trace = go.Scatter(
            mode="markers",
            x=ticks_down,
            y=y_down,
            marker_symbol="triangle-up",
            name="谷",
        )
        self.main_traces["valleys"] = trace

    def add_bounding_box(self, boxes: List[Tuple]):
        """bbox是标记在k线图上某个区间内的矩形框,它以该区间最高价和最低价为上下边。

        Args:
            boxes: 每个元素(start, width)表示各个bbox的起点和宽度。
        """
        for j, box in enumerate(boxes):
            x, y = [], []
            i, width = box
            if len(x):
                x.append(None)
                y.append(None)

            group = self.bars[i : i + width]

            mean = np.mean(group["close"])
            std = 2 * np.std(group["close"])

            # 落在两个标准差以内的实体最上方和最下方值
            hc = np.max(group[group["close"] < mean + std]["close"])
            lc = np.min(group[group["close"] > mean - std]["close"])

            ho = np.max(group[group["open"] < mean + std]["open"])
            lo = np.min(group[group["open"] > mean - std]["open"])

            h = max(hc, ho)
            low = min(lo, lc)

            x.extend(self.ticks[[i, i + width - 1, i + width - 1, i, i]])
            y.extend((h, h, low, low, h))

            hover = f"宽度: {width}<br>振幅: {h/low - 1:.2%}"
            trace = go.Scatter(x=x, y=y, fill="toself", name=f"平台整理{j}", text=hover)
            self.main_traces[f"bbox-{j}"] = trace

    def add_indicator(self, indicator: str, **kwargs):
        """向k线图中增加技术指标

        Args:
            indicator: 当前支持值有'volume', 'rsi', 'bbands'
            kwargs: 计算某个indicator时,需要的参数。比如计算bbands时,需要传入均线的window
        """
        if indicator == "volume":
            colors = np.repeat(self.RED, len(self.bars))
            colors[self.bars["close"] <= self.bars["open"]] = self.GREEN

            trace = go.Bar(
                x=self.ticks,
                y=self.bars["volume"],
                showlegend=False,
                marker={"color": colors},
            )
        elif indicator == "rsi":
            win = kwargs.get("win")
            rsi = talib.RSI(self._bar_close, win)  # type: ignore
            trace = go.Scatter(x=self.ticks, y=rsi, showlegend=False)
        elif indicator == "bbands":
            self._remove_ma()
            win = kwargs.get("win")
            for name, ind in zip(
                ["bbands-high", "bbands-mean", "bbands-low"],
                talib.BBANDS(self._bar_close, win),  # type: ignore
            ):
                trace = go.Scatter(x=self.ticks, y=ind, showlegend=True, name=name)
                self.main_traces[name] = trace

            return
        else:
            raise ValueError(f"{indicator} not supported")

        self.ind_traces[indicator] = trace

    def add_marks(
        self,
        x: List[int],
        y: List[float],
        name: str,
        marker: str = "cross",
        color: Optional[str] = None,
    ):
        """向k线图中增加标记点"""
        trace = go.Scatter(
            x=self.ticks[x],
            y=y,
            mode="markers",
            marker_symbol=marker,
            marker_color=color,
            name=name,
        )
        self.main_traces[name] = trace

    def plot(self):
        """绘制图表"""
        fig = self.figure
        ymin = np.min(self.bars["low"])
        ymax = np.max(self.bars["high"])

        ylim = [ymin * 0.95, ymax * 1.05]
        fig.update_layout(yaxis=dict(range=ylim))
        fig.show()
figure
property
readonly
返回一个figure对象
__init__(self, bars, ma_groups=None, win_size=120, title=None, show_volume=True, show_rsi=True, show_peaks=False, **kwargs)
special
构造函数
Parameters:
| Name | Type | Description | Default |
|---|---|---|---|
bars |
ndarray |
行情数据 |
required |
ma_groups |
List[int] |
均线组参数。比如[5, 10, 20]表明向k线图中添加5, 10, 20日均线。如果不提供,将从数组[5, 10, 20, 30, 60, 120, 250]中取直到与 |
None |
win_size |
int |
缺省绘制多少个bar,超出部分将不显示。 |
120 |
title |
str |
k线图的标题 |
None |
show_volume |
是否显示成交量图 |
True |
|
show_rsi |
是否显示RSI图。缺省显示参数为6的RSI图。 |
True |
|
show_peaks |
是否标记检测出来的峰跟谷。 |
False |
Kwargs
rsi_win: default is 6
Source code in omicron/plotting/candlestick.py
def __init__(
    self,
    bars: np.ndarray,
    ma_groups: List[int] = None,
    win_size: int = 120,
    title: str = None,
    show_volume=True,
    show_rsi=True,
    show_peaks=False,
    **kwargs,
):
    """构造函数

    Args:
        bars: 行情数据
        ma_groups: 均线组参数。比如[5, 10, 20]表明向k线图中添加5, 10, 20日均线。如果不提供,将从数组[5, 10, 20, 30, 60, 120, 250]中取直到与`len(bars) - 5`匹配的参数为止。比如bars长度为30,则将取[5, 10, 20]来绘制均线。
        win_size: 缺省绘制多少个bar,超出部分将不显示。
        title: k线图的标题
        show_volume: 是否显示成交量图
        show_rsi: 是否显示RSI图。缺省显示参数为6的RSI图。
        show_peaks: 是否标记检测出来的峰跟谷。
    kwargs:
        rsi_win: default is 6
    """
    self.title = title
    self.bars = bars
    self.win_size = win_size

    # traces for main area
    self.main_traces = {}

    # traces for indicator area
    self.ind_traces = {}

    self.ticks = self._format_tick(bars["frame"])
    self._bar_close = array_math_round(bars["close"], 2).astype(np.float64)

    # for every candlestick, it must contain a candlestick plot
    cs = go.Candlestick(
        x=self.ticks,
        open=bars["open"],
        high=bars["high"],
        low=bars["low"],
        close=self._bar_close,
        line=dict({"width": 1}),
        name="K线",
        **kwargs,
    )

    # Set line and fill colors
    cs.increasing.fillcolor = "rgba(255,255,255,0.9)"
    cs.increasing.line.color = self.RED
    cs.decreasing.fillcolor = self.GREEN
    cs.decreasing.line.color = self.GREEN

    self.main_traces["ohlc"] = cs

    if show_volume:
        self.add_indicator("volume")

    if show_peaks:
        self.add_main_trace("peaks")

    if show_rsi:
        self.add_indicator("rsi", win=kwargs.get("rsi_win", 6))

    # 增加均线
    if ma_groups is None:
        nbars = len(bars)
        if nbars < 9:
            ma_groups = []
        else:
            groups = np.array([5, 10, 20, 30, 60, 120, 250])
            idx = max(np.argwhere(groups < (nbars - 5))).item() + 1
            ma_groups = groups[:idx]

    for win in ma_groups:
        name = f"ma{win}"
        if win > len(bars):
            continue
        ma = moving_average(self._bar_close, win)
        line = go.Scatter(
            y=ma,
            x=self.ticks,
            name=name,
            line=dict(width=1, color=self.MA_COLORS.get(win)),
        )
        self.main_traces[name] = line
add_bounding_box(self, boxes)
bbox是标记在k线图上某个区间内的矩形框,它以该区间最高价和最低价为上下边。
Parameters:
| Name | Type | Description | Default |
|---|---|---|---|
boxes |
List[Tuple] |
每个元素(start, width)表示各个bbox的起点和宽度。 |
required |
Source code in omicron/plotting/candlestick.py
def add_bounding_box(self, boxes: List[Tuple]):
    """bbox是标记在k线图上某个区间内的矩形框,它以该区间最高价和最低价为上下边。

    Args:
        boxes: 每个元素(start, width)表示各个bbox的起点和宽度。
    """
    for j, box in enumerate(boxes):
        x, y = [], []
        i, width = box
        if len(x):
            x.append(None)
            y.append(None)

        group = self.bars[i : i + width]

        mean = np.mean(group["close"])
        std = 2 * np.std(group["close"])

        # 落在两个标准差以内的实体最上方和最下方值
        hc = np.max(group[group["close"] < mean + std]["close"])
        lc = np.min(group[group["close"] > mean - std]["close"])

        ho = np.max(group[group["open"] < mean + std]["open"])
        lo = np.min(group[group["open"] > mean - std]["open"])

        h = max(hc, ho)
        low = min(lo, lc)

        x.extend(self.ticks[[i, i + width - 1, i + width - 1, i, i]])
        y.extend((h, h, low, low, h))

        hover = f"宽度: {width}<br>振幅: {h/low - 1:.2%}"
        trace = go.Scatter(x=x, y=y, fill="toself", name=f"平台整理{j}", text=hover)
        self.main_traces[f"bbox-{j}"] = trace
add_indicator(self, indicator, **kwargs)
向k线图中增加技术指标
Parameters:
| Name | Type | Description | Default |
|---|---|---|---|
indicator |
str |
当前支持值有'volume', 'rsi', 'bbands' |
required |
kwargs |
计算某个indicator时,需要的参数。比如计算bbands时,需要传入均线的window |
{} |
Source code in omicron/plotting/candlestick.py
def add_indicator(self, indicator: str, **kwargs):
    """向k线图中增加技术指标

    Args:
        indicator: 当前支持值有'volume', 'rsi', 'bbands'
        kwargs: 计算某个indicator时,需要的参数。比如计算bbands时,需要传入均线的window
    """
    if indicator == "volume":
        colors = np.repeat(self.RED, len(self.bars))
        colors[self.bars["close"] <= self.bars["open"]] = self.GREEN

        trace = go.Bar(
            x=self.ticks,
            y=self.bars["volume"],
            showlegend=False,
            marker={"color": colors},
        )
    elif indicator == "rsi":
        win = kwargs.get("win")
        rsi = talib.RSI(self._bar_close, win)  # type: ignore
        trace = go.Scatter(x=self.ticks, y=rsi, showlegend=False)
    elif indicator == "bbands":
        self._remove_ma()
        win = kwargs.get("win")
        for name, ind in zip(
            ["bbands-high", "bbands-mean", "bbands-low"],
            talib.BBANDS(self._bar_close, win),  # type: ignore
        ):
            trace = go.Scatter(x=self.ticks, y=ind, showlegend=True, name=name)
            self.main_traces[name] = trace

        return
    else:
        raise ValueError(f"{indicator} not supported")

    self.ind_traces[indicator] = trace
add_line(self, trace_name, x, y)
在k线图上增加以x,y表示的一条直线
Parameters:
| Name | Type | Description | Default |
|---|---|---|---|
trace_name |
图例名称 |
required | |
x |
x轴坐标,所有的x值都必须属于[0, len(self.bars)] |
required | |
y |
y值 |
required |
Source code in omicron/plotting/candlestick.py
def add_line(self, trace_name: str, x: List[int], y: List[float]):
    """在k线图上增加以`x`,`y`表示的一条直线

    Args:
        trace_name : 图例名称
        x : x轴坐标,所有的x值都必须属于[0, len(self.bars)]
        y : y值
    """
    line = go.Scatter(x=self.ticks[x], y=y, mode="lines", name=trace_name)

    self.main_traces[trace_name] = line
add_main_trace(self, trace_name, **kwargs)
add trace to main plot
支持的图例类别有peaks, bbox(bounding-box), bt(回测), support_line, resist_line
Parameters:
| Name | Type | Description | Default |
|---|---|---|---|
trace_name |
图例名称 |
required | |
**kwargs |
其他参数 |
{} |
Source code in omicron/plotting/candlestick.py
def add_main_trace(self, trace_name: str, **kwargs):
    """add trace to main plot

    支持的图例类别有peaks, bbox(bounding-box), bt(回测), support_line, resist_line
    Args:
        trace_name : 图例名称
        **kwargs : 其他参数

    """
    if trace_name == "peaks":
        self.mark_peaks_and_valleys(
            kwargs.get("up_thres", 0.03), kwargs.get("down_thres", -0.03)
        )

    # 标注矩形框
    elif trace_name == "bbox":
        self.add_bounding_box(kwargs.get("boxes"))

    # 回测结果
    elif trace_name == "bt":
        self.add_backtest_result(kwargs.get("bt"))

    # 增加直线
    elif trace_name == "support_line":
        self.add_line("支撑线", kwargs.get("x"), kwargs.get("y"))

    elif trace_name == "resist_line":
        self.add_line("压力线", kwargs.get("x"), kwargs.get("y"))
add_marks(self, x, y, name, marker='cross', color=None)
向k线图中增加标记点
Source code in omicron/plotting/candlestick.py
def add_marks(
    self,
    x: List[int],
    y: List[float],
    name: str,
    marker: str = "cross",
    color: Optional[str] = None,
):
    """向k线图中增加标记点"""
    trace = go.Scatter(
        x=self.ticks[x],
        y=y,
        mode="markers",
        marker_symbol=marker,
        marker_color=color,
        name=name,
    )
    self.main_traces[name] = trace
mark_backtest_result(self, result)
标记买卖点和回测数据
Todo
此方法可能未与backtest返回值同步。此外,在portofolio回测中,不可能在k线图中使用此方法。
Parameters:
| Name | Type | Description | Default |
|---|---|---|---|
points |
买卖点的坐标。 |
required |
Source code in omicron/plotting/candlestick.py
def mark_backtest_result(self, result: dict):
    """标记买卖点和回测数据

    TODO:
        此方法可能未与backtest返回值同步。此外,在portofolio回测中,不可能在k线图中使用此方法。

    Args:
        points : 买卖点的坐标。
    """
    trades = result.get("trades")
    assets = result.get("assets")

    x, y, labels = [], [], []
    hover = []
    labels_color = defaultdict(list)

    for trade in trades:
        trade_date = arrow.get(trade["time"]).date()
        asset = assets.get(trade_date)

        security = trade["security"]
        price = trade["price"]
        volume = trade["volume"]

        side = trade["order_side"]

        x.append(self._format_tick(trade_date))

        bar = self.bars[self.bars["frame"] == trade_date]
        if side == "买入":
            hover.append(
                f"总资产:{asset}<br><br>{side}:{security}<br>买入价:{price}<br>股数:{volume}"
            )

            y.append(bar["high"][0] * 1.1)
            labels.append("B")
            labels_color["color"].append(self.RED)

        else:
            y.append(bar["low"][0] * 0.99)

            hover.append(
                f"总资产:{asset}<hr><br>{side}:{security}<br>卖出价:{price}<br>股数:{volume}"
            )

            labels.append("S")
            labels_color["color"].append(self.GREEN)

            labels_color.append(self.GREEN)
            # txt.append(f'{side}:{security}<br>卖出价:{price}<br>股数:{volume}')

    trace = go.Scatter(
        x=x,
        y=y,
        mode="text",
        text=labels,
        name="backtest",
        hovertext=hover,
        textfont=labels_color,
    )

    self.main_traces["bs"] = trace
mark_bbox(self, min_size=20)
在k线图上检测并标注矩形框
Parameters:
| Name | Type | Description | Default |
|---|---|---|---|
min_size |
矩形框的最小长度 |
20 |
Source code in omicron/plotting/candlestick.py
def mark_bbox(self, min_size: int = 20):
    """在k线图上检测并标注矩形框

    Args:
        min_size : 矩形框的最小长度

    """
    boxes = plateaus(self._bar_close, min_size)
    self.add_main_trace("bbox", boxes=boxes)
mark_peaks_and_valleys(self, up_thres=None, down_thres=None)
在K线图上标注峰谷点
Parameters:
| Name | Type | Description | Default |
|---|---|---|---|
up_thres |
用来检测峰谷时使用的阈值,参见omicron.talib.morph.peaks_and_valleys |
None |
|
down_thres |
用来检测峰谷时使用的阈值,参见omicron.talib.morph.peaks_and_valleys |
None |
Source code in omicron/plotting/candlestick.py
def mark_peaks_and_valleys(
    self, up_thres: Optional[float] = None, down_thres: Optional[float] = None
):
    """在K线图上标注峰谷点

    Args:
        up_thres : 用来检测峰谷时使用的阈值,参见[omicron.talib.morph.peaks_and_valleys][]
        down_thres : 用来检测峰谷时使用的阈值,参见[omicron.talib.morph.peaks_and_valleys][]

    """
    bars = self.bars

    flags = peaks_and_valleys(self._bar_close, up_thres, down_thres)

    # 移除首尾的顶底标记,一般情况下它们都不是真正的顶和底。
    flags[0] = 0
    flags[-1] = 0

    marker_margin = (max(bars["high"]) - min(bars["low"])) * 0.05
    ticks_up = self.ticks[flags == 1]
    y_up = bars["high"][flags == 1] + marker_margin
    ticks_down = self.ticks[flags == -1]
    y_down = bars["low"][flags == -1] - marker_margin

    trace = go.Scatter(
        mode="markers", x=ticks_up, y=y_up, marker_symbol="triangle-down", name="峰"
    )
    self.main_traces["peaks"] = trace

    trace = go.Scatter(
        mode="markers",
        x=ticks_down,
        y=y_down,
        marker_symbol="triangle-up",
        name="谷",
    )
    self.main_traces["valleys"] = trace
mark_support_resist_lines(self, upthres=None, downthres=None, use_close=True, win=60)
在K线图上标注支撑线和压力线
在win个k线内,找出所有的局部峰谷点,并以最高的两个峰连线生成压力线,以最低的两个谷连线生成支撑线。
Parameters:
| Name | Type | Description | Default |
|---|---|---|---|
upthres |
用来检测峰谷时使用的阈值,参见 |
None |
|
downthres |
用来检测峰谷时使用的阈值,参见 |
None |
|
use_close |
是否使用收盘价来进行检测。如果为False,则使用high来检测压力线,使用low来检测支撑线. |
True |
|
win |
检测局部高低点的窗口. |
60 |
Source code in omicron/plotting/candlestick.py
def mark_support_resist_lines(
    self, upthres: float = None, downthres: float = None, use_close=True, win=60
):
    """在K线图上标注支撑线和压力线

    在`win`个k线内,找出所有的局部峰谷点,并以最高的两个峰连线生成压力线,以最低的两个谷连线生成支撑线。

    Args:
        upthres : 用来检测峰谷时使用的阈值,参见`omicron.talib.morph.peaks_and_valleys`
        downthres : 用来检测峰谷时使用的阈值,参见`omicron.talib.morph.peaks_and_valleys`.
        use_close : 是否使用收盘价来进行检测。如果为False,则使用high来检测压力线,使用low来检测支撑线.
        win : 检测局部高低点的窗口.
    """
    bars = self.bars[-win:]
    clipped = len(self.bars) - win

    if use_close:
        support, resist, x_start = support_resist_lines(
            self._bar_close, upthres, downthres
        )
        x = np.arange(len(bars))[x_start:]

        self.add_main_trace("support_line", x=x + clipped, y=support(x))
        self.add_main_trace("resist_line", x=x + clipped, y=resist(x))

    else:  # 使用"high"和"low"
        bars = self.bars[-win:]
        support, _, x_start = support_resist_lines(bars["low"], upthres, downthres)
        x = np.arange(len(bars))[x_start:]
        self.add_main_trace("support_line", x=x + clipped, y=support(x))

        _, resist, x_start = support_resist_lines(bars["high"], upthres, downthres)
        x = np.arange(len(bars))[x_start:]
        self.add_main_trace("resist_line", x=x + clipped, y=resist(x))
plot(self)
绘制图表
Source code in omicron/plotting/candlestick.py
def plot(self):
    """绘制图表"""
    fig = self.figure
    ymin = np.min(self.bars["low"])
    ymax = np.max(self.bars["high"])

    ylim = [ymin * 0.95, ymax * 1.05]
    fig.update_layout(yaxis=dict(range=ylim))
    fig.show()