core
angle(ts, threshold=0.01, loss_func='re')
求时间序列ts拟合直线相对于x轴的夹角的余弦值
本函数可以用来判断时间序列的增长趋势。当angle处于[-1, 0]时,越靠近0,下降越快;当angle
处于[0, 1]时,越接近0,上升越快。
如果ts无法很好地拟合为直线,则返回[float, None]
Examples:
>>> ts = np.array([ i for i in range(5)])
>>> round(angle(ts)[1], 3) # degree: 45, rad: pi/2
0.707
>>> ts = np.array([ np.sqrt(3) / 3 * i for i in range(10)])
>>> round(angle(ts)[1],3) # degree: 30, rad: pi/6
0.866
>>> ts = np.array([ -np.sqrt(3) / 3 * i for i in range(7)])
>>> round(angle(ts)[1], 3) # degree: 150, rad: 5*pi/6
-0.866
Parameters:
| Name | Type | Description | Default |
|---|---|---|---|
ts |
required |
Returns:
| Type | Description |
|---|---|
Tuple[float, float] |
返回 (error, consine(theta)),即拟合误差和夹角余弦值。 |
Source code in omicron/talib/core.py
def angle(ts, threshold=0.01, loss_func="re") -> Tuple[float, float]:
    """求时间序列`ts`拟合直线相对于`x`轴的夹角的余弦值

    本函数可以用来判断时间序列的增长趋势。当`angle`处于[-1, 0]时,越靠近0,下降越快;当`angle`
    处于[0, 1]时,越接近0,上升越快。

    如果`ts`无法很好地拟合为直线,则返回[float, None]

    Examples:

        >>> ts = np.array([ i for i in range(5)])
        >>> round(angle(ts)[1], 3) # degree: 45, rad: pi/2
        0.707

        >>> ts = np.array([ np.sqrt(3) / 3 * i for i in range(10)])
        >>> round(angle(ts)[1],3) # degree: 30, rad: pi/6
        0.866

        >>> ts = np.array([ -np.sqrt(3) / 3 * i for i in range(7)])
        >>> round(angle(ts)[1], 3) # degree: 150, rad: 5*pi/6
        -0.866

    Args:
        ts:

    Returns:
        返回 (error, consine(theta)),即拟合误差和夹角余弦值。

    """
    err, (a, b) = polyfit(ts, deg=1, loss_func=loss_func)
    if err > threshold:
        return (err, None)

    v = np.array([1, a + b])
    vx = np.array([1, 0])

    return err, copysign(np.dot(v, vx) / (norm(v) * norm(vx)), a)
clustering(numbers, n)
将数组numbers划分为n个簇
返回值为一个List, 每一个元素为一个列表,分别为簇的起始点和长度。
Examples:
>>> numbers = np.array([1,1,1,2,4,6,8,7,4,5,6])
>>> clustering(numbers, 2)
[(0, 4), (4, 7)]
Returns:
| Type | Description |
|---|---|
List[Tuple[int, int]] |
划分后的簇列表。 |
Source code in omicron/talib/core.py
def clustering(numbers: np.ndarray, n: int) -> List[Tuple[int, int]]:
    """将数组`numbers`划分为`n`个簇

    返回值为一个List, 每一个元素为一个列表,分别为簇的起始点和长度。

    Examples:
        >>> numbers = np.array([1,1,1,2,4,6,8,7,4,5,6])
        >>> clustering(numbers, 2)
        [(0, 4), (4, 7)]

    Returns:
        划分后的簇列表。
    """
    result = ckwrap.cksegs(numbers, n)

    clusters = []
    for pos, size in zip(result.centers, result.sizes):
        clusters.append((int(pos - size // 2 - 1), int(size)))

    return clusters
exp_moving_average(values, window)
Numpy implementation of EMA
Source code in omicron/talib/core.py
def exp_moving_average(values, window):
    """Numpy implementation of EMA"""
    weights = np.exp(np.linspace(-1.0, 0.0, window))
    weights /= weights.sum()
    a = np.convolve(values, weights, mode="full")[: len(values)]
    a[:window] = a[window]

    return a
mean_absolute_error(y, y_hat)
返回预测序列相对于真值序列的平均绝对值差
两个序列应该具有相同的长度。如果存在nan,则nan的值不计入平均值。
Examples:
>>> y = np.arange(5)
>>> y_hat = np.arange(5)
>>> y_hat[4] = 0
>>> mean_absolute_error(y, y)
0.0
>>> mean_absolute_error(y, y_hat)
0.8
Parameters:
| Name | Type | Description | Default |
|---|---|---|---|
y |
np.array |
真值序列 |
required |
y_hat |
<built-in function array> |
比较序列 |
required |
Returns:
| Type | Description |
|---|---|
float |
平均绝对值差 |
Source code in omicron/talib/core.py
def mean_absolute_error(y: np.array, y_hat: np.array) -> float:
    """返回预测序列相对于真值序列的平均绝对值差

    两个序列应该具有相同的长度。如果存在nan,则nan的值不计入平均值。

    Examples:

        >>> y = np.arange(5)
        >>> y_hat = np.arange(5)
        >>> y_hat[4] = 0
        >>> mean_absolute_error(y, y)
        0.0

        >>> mean_absolute_error(y, y_hat)
        0.8

    Args:
        y (np.array): 真值序列
        y_hat: 比较序列

    Returns:
        float: 平均绝对值差
    """
    return nanmean(np.abs(y - y_hat))
moving_average(ts, win, padding=True)
生成ts序列的移动平均值
Examples:
>>> ts = np.arange(7)
>>> moving_average(ts, 5)
array([nan, nan, nan, nan,  2.,  3.,  4.])
Parameters:
| Name | Type | Description | Default |
|---|---|---|---|
ts |
Sequence |
the input array |
required |
win |
int |
the window size |
required |
padding |
if True, then the return will be equal length as input, padding with np.NaN at the beginning |
True |
Returns:
| Type | Description |
|---|---|
ndarray |
The moving mean of the input array along the specified axis. The output has the same shape as the input. |
Source code in omicron/talib/core.py
def moving_average(ts: Sequence, win: int, padding=True) -> np.ndarray:
    """生成ts序列的移动平均值

    Examples:

        >>> ts = np.arange(7)
        >>> moving_average(ts, 5)
        array([nan, nan, nan, nan,  2.,  3.,  4.])

    Args:
        ts (Sequence): the input array
        win (int): the window size
        padding: if True, then the return will be equal length as input, padding with np.NaN at the beginning

    Returns:
        The moving mean of the input array along the specified axis. The output has the same shape as the input.
    """
    ma = move_mean(ts, win)
    if padding:
        return ma
    else:
        return ma[win - 1 :]
normalize(X, scaler='maxabs')
对数据进行规范化处理。
如果scaler为maxabs,则X的各元素被压缩到[-1,1]之间 如果scaler为unit_vector,则将X的各元素压缩到单位范数 如果scaler为minmax,则X的各元素被压缩到[0,1]之间 如果scaler为standard,则X的各元素被压缩到单位方差之间,且均值为零。
参考 sklearn
Examples:
>>> X = [[ 1., -1.,  2.],
... [ 2.,  0.,  0.],
... [ 0.,  1., -1.]]
>>> expected = [[ 0.4082, -0.4082,  0.8165],
... [ 1.,  0.,  0.],
... [ 0.,  0.7071, -0.7071]]
>>> X_hat = normalize(X, scaler='unit_vector')
>>> np.testing.assert_array_almost_equal(expected, X_hat, decimal=4)
>>> expected = [[0.5, -1., 1.],
... [1., 0., 0.],
... [0., 1., -0.5]]
>>> X_hat = normalize(X, scaler='maxabs')
>>> np.testing.assert_array_almost_equal(expected, X_hat, decimal = 2)
>>> expected = [[0.5       , 0.        , 1.        ],
... [1.        , 0.5       , 0.33333333],
... [0.        , 1.        , 0.        ]]
>>> X_hat = normalize(X, scaler='minmax')
>>> np.testing.assert_array_almost_equal(expected, X_hat, decimal= 3)
>>> X = [[0, 0],
... [0, 0],
... [1, 1],
... [1, 1]]
>>> expected = [[-1., -1.],
... [-1., -1.],
... [ 1., 1.],
... [ 1.,  1.]]
>>> X_hat = normalize(X, scaler='standard')
>>> np.testing.assert_array_almost_equal(expected, X_hat, decimal = 3)
Parameters:
| Name | Type | Description | Default |
|---|---|---|---|
X |
2D array |
required | |
scaler |
str |
[description]. Defaults to 'maxabs_scale'. |
'maxabs' |
Source code in omicron/talib/core.py
def normalize(X, scaler="maxabs"):
    """对数据进行规范化处理。

    如果scaler为maxabs,则X的各元素被压缩到[-1,1]之间
    如果scaler为unit_vector,则将X的各元素压缩到单位范数
    如果scaler为minmax,则X的各元素被压缩到[0,1]之间
    如果scaler为standard,则X的各元素被压缩到单位方差之间,且均值为零。

    参考 [sklearn]

    [sklearn]: https://scikit-learn.org/stable/auto_examples/preprocessing/plot_all_scaling.html#results

    Examples:

        >>> X = [[ 1., -1.,  2.],
        ... [ 2.,  0.,  0.],
        ... [ 0.,  1., -1.]]

        >>> expected = [[ 0.4082, -0.4082,  0.8165],
        ... [ 1.,  0.,  0.],
        ... [ 0.,  0.7071, -0.7071]]

        >>> X_hat = normalize(X, scaler='unit_vector')
        >>> np.testing.assert_array_almost_equal(expected, X_hat, decimal=4)

        >>> expected = [[0.5, -1., 1.],
        ... [1., 0., 0.],
        ... [0., 1., -0.5]]

        >>> X_hat = normalize(X, scaler='maxabs')
        >>> np.testing.assert_array_almost_equal(expected, X_hat, decimal = 2)

        >>> expected = [[0.5       , 0.        , 1.        ],
        ... [1.        , 0.5       , 0.33333333],
        ... [0.        , 1.        , 0.        ]]
        >>> X_hat = normalize(X, scaler='minmax')
        >>> np.testing.assert_array_almost_equal(expected, X_hat, decimal= 3)

        >>> X = [[0, 0],
        ... [0, 0],
        ... [1, 1],
        ... [1, 1]]
        >>> expected = [[-1., -1.],
        ... [-1., -1.],
        ... [ 1., 1.],
        ... [ 1.,  1.]]
        >>> X_hat = normalize(X, scaler='standard')
        >>> np.testing.assert_array_almost_equal(expected, X_hat, decimal = 3)

    Args:
        X (2D array):
        scaler (str, optional): [description]. Defaults to 'maxabs_scale'.
    """
    if scaler == "maxabs":
        return MaxAbsScaler().fit_transform(X)
    elif scaler == "unit_vector":
        return sklearn.preprocessing.normalize(X, norm="l2")
    elif scaler == "minmax":
        return minmax_scale(X)
    elif scaler == "standard":
        return StandardScaler().fit_transform(X)
pct_error(y, y_hat)
相对于序列算术均值的误差值
Examples:
>>> y = np.arange(5)
>>> y_hat = np.arange(5)
>>> y_hat[4] = 0
>>> pct_error(y, y_hat)
0.4
Parameters:
| Name | Type | Description | Default |
|---|---|---|---|
y |
np.array |
[description] |
required |
y_hat |
np.array |
[description] |
required |
Returns:
| Type | Description |
|---|---|
float |
[description] |
Source code in omicron/talib/core.py
def pct_error(y: np.array, y_hat: np.array) -> float:
    """相对于序列算术均值的误差值

    Examples:
        >>> y = np.arange(5)
        >>> y_hat = np.arange(5)
        >>> y_hat[4] = 0
        >>> pct_error(y, y_hat)
        0.4

    Args:
        y (np.array): [description]
        y_hat (np.array): [description]

    Returns:
        float: [description]
    """
    mae = mean_absolute_error(y, y_hat)
    return mae / nanmean(np.abs(y))
polyfit(ts, deg=2, loss_func='re')
对给定的时间序列进行直线/二次曲线拟合。
二次曲线可以拟合到反生反转的行情,如圆弧底、圆弧顶;也可以拟合到上述趋势中的单边走势,即其中一段曲线。对于如长期均线,在一段时间内走势可能呈现为一条直线,故也可用此函数进行直线拟合。
为便于在不同品种、不同的时间之间对误差、系数进行比较,请事先对ts进行归一化。 如果遇到无法拟合的情况(异常),将返回一个非常大的误差,并将其它项置为np.nan
Examples:
>>> ts = [i for i in range(5)]
>>> err, (a, b) = polyfit(ts, deg=1)
>>> print(round(err, 3), round(a, 1))
0.0 1.0
Parameters:
| Name | Type | Description | Default |
|---|---|---|---|
ts |
Sequence |
待拟合的时间序列 |
required |
deg |
int |
如果要进行直线拟合,取1;二次曲线拟合取2. Defaults to 2 |
2 |
loss_func |
str |
误差计算方法,取值为 |
're' |
Returns:
| Type | Description |
|---|---|
[Tuple] |
如果为直线拟合,返回误差,(a,b)(一次项系数和常数)。如果为二次曲线拟合,返回 误差, (a,b,c)(二次项、一次项和常量), (vert_x, vert_y)(顶点处的index,顶点值) |
Source code in omicron/talib/core.py
def polyfit(ts: Sequence, deg: int = 2, loss_func="re") -> Tuple:
    """对给定的时间序列进行直线/二次曲线拟合。

    二次曲线可以拟合到反生反转的行情,如圆弧底、圆弧顶;也可以拟合到上述趋势中的单边走势,即其中一段曲线。对于如长期均线,在一段时间内走势可能呈现为一条直线,故也可用此函数进行直线拟合。

    为便于在不同品种、不同的时间之间对误差、系数进行比较,请事先对ts进行归一化。
    如果遇到无法拟合的情况(异常),将返回一个非常大的误差,并将其它项置为np.nan

    Examples:
        >>> ts = [i for i in range(5)]
        >>> err, (a, b) = polyfit(ts, deg=1)
        >>> print(round(err, 3), round(a, 1))
        0.0 1.0

    Args:
        ts (Sequence): 待拟合的时间序列
        deg (int): 如果要进行直线拟合,取1;二次曲线拟合取2. Defaults to 2
        loss_func (str): 误差计算方法,取值为`mae`, `rmse`,`mse` 或`re`。Defaults to `re` (relative_error)
    Returns:
        [Tuple]: 如果为直线拟合,返回误差,(a,b)(一次项系数和常数)。如果为二次曲线拟合,返回
        误差, (a,b,c)(二次项、一次项和常量), (vert_x, vert_y)(顶点处的index,顶点值)
    """
    if deg not in (1, 2):
        raise ValueError("deg must be 1 or 2")

    try:
        if any(np.isnan(ts)):
            raise ValueError("ts contains nan")

        x = np.array(list(range(len(ts))))

        z = np.polyfit(x, ts, deg=deg)

        p = np.poly1d(z)
        ts_hat = np.array([p(xi) for xi in x])

        if loss_func == "mse":
            error = np.mean(np.square(ts - ts_hat))
        elif loss_func == "rmse":
            error = np.sqrt(np.mean(np.square(ts - ts_hat)))
        elif loss_func == "mae":
            error = mean_absolute_error(ts, ts_hat)
        else:  # defaults to relative error
            error = pct_error(ts, ts_hat)

        if deg == 2:
            a, b, c = z[0], z[1], z[2]
            axis_x = -b / (2 * a)
            if a != 0:
                axis_y = (4 * a * c - b * b) / (4 * a)
            else:
                axis_y = None
            return error, z, (axis_x, axis_y)
        elif deg == 1:
            return error, z
    except Exception:
        error = 1e9
        if deg == 1:
            return error, (np.nan, np.nan)
        else:
            return error, (np.nan, np.nan, np.nan), (np.nan, np.nan)
slope(ts, loss_func='re')
求ts表示的直线(如果能拟合成直线的话)的斜率
Parameters:
| Name | Type | Description | Default |
|---|---|---|---|
ts |
np.array |
[description] |
required |
loss_func |
str |
[description]. Defaults to 're'. |
're' |
Source code in omicron/talib/core.py
def slope(ts: np.array, loss_func="re"):
    """求ts表示的直线(如果能拟合成直线的话)的斜率

    Args:
        ts (np.array): [description]
        loss_func (str, optional): [description]. Defaults to 're'.
    """
    err, (a, b) = polyfit(ts, deg=1, loss_func=loss_func)

    return err, a
smooth(ts, win, poly_order=1, mode='interp')
平滑序列ts,使用窗口大小为win的平滑模型,默认使用线性模型
提供本函数主要基于这样的考虑: omicron的使用者可能并不熟悉信号处理的概念,这里相当于提供了相关功能的一个入口。
Parameters:
| Name | Type | Description | Default |
|---|---|---|---|
ts |
np.array |
[description] |
required |
win |
int |
[description] |
required |
poly_order |
int |
[description]. Defaults to 1. |
1 |
Source code in omicron/talib/core.py
def smooth(ts: np.array, win: int, poly_order=1, mode="interp"):
    """平滑序列ts,使用窗口大小为win的平滑模型,默认使用线性模型

    提供本函数主要基于这样的考虑: omicron的使用者可能并不熟悉信号处理的概念,这里相当于提供了相关功能的一个入口。

    Args:
        ts (np.array): [description]
        win (int): [description]
        poly_order (int, optional): [description]. Defaults to 1.
    """
    return savgol_filter(ts, win, poly_order, mode=mode)
weighted_moving_average(ts, win)
计算加权移动平均
Parameters:
| Name | Type | Description | Default |
|---|---|---|---|
ts |
np.array |
[description] |
required |
win |
int |
[description] |
required |
Returns:
| Type | Description |
|---|---|
np.array |
[description] |
Source code in omicron/talib/core.py
def weighted_moving_average(ts: np.array, win: int) -> np.array:
    """计算加权移动平均

    Args:
        ts (np.array): [description]
        win (int): [description]

    Returns:
        np.array: [description]
    """
    w = [2 * (i + 1) / (win * (win + 1)) for i in range(win)]

    return np.convolve(ts, w, "valid")
morph
形态检测相关方法
BreakoutFlag (IntEnum)
An enumeration.
Source code in omicron/talib/morph.py
class BreakoutFlag(IntEnum):
    UP = 1
    DOWN = -1
    NONE = 0
CrossFlag (IntEnum)
An enumeration.
Source code in omicron/talib/morph.py
class CrossFlag(IntEnum):
    UPCROSS = 1
    DOWNCROSS = -1
    NONE = 0
breakout(ts, upthres=0.01, downthres=-0.01, confirm=1)
检测时间序列是否突破了压力线(整理线)
Parameters:
| Name | Type | Description | Default |
|---|---|---|---|
ts |
np.ndarray |
时间序列 |
required |
upthres |
float |
0.01 |
|
downthres |
float |
-0.01 |
|
confirm |
int |
经过多少个bars后,才确认突破。默认为1 |
1 |
Returns:
| Type | Description |
|---|---|
BreakoutFlag |
如果上向突破压力线,返回1,如果向下突破压力线,返回-1,否则返回0 |
Source code in omicron/talib/morph.py
def breakout(
    ts: np.ndarray, upthres: float = 0.01, downthres: float = -0.01, confirm: int = 1
) -> BreakoutFlag:
    """检测时间序列是否突破了压力线(整理线)

    Args:
        ts (np.ndarray): 时间序列
        upthres (float, optional): 请参考[peaks_and_valleys][omicron.talib.morph.peaks_and_valleys]
        downthres (float, optional): 请参考[peaks_and_valleys][omicron.talib.morph.peaks_and_valleys]
        confirm (int, optional): 经过多少个bars后,才确认突破。默认为1

    Returns:
        如果上向突破压力线,返回1,如果向下突破压力线,返回-1,否则返回0
    """
    support, resist, _ = support_resist_lines(ts[:-confirm], upthres, downthres)

    x0 = len(ts) - confirm - 1
    x = list(range(len(ts) - confirm, len(ts)))

    if resist is not None:
        if np.all(ts[x] > resist(x)) and ts[x0] <= resist(x0):
            return BreakoutFlag.UP

    if support is not None:
        if np.all(ts[x] < support(x)) and ts[x0] >= support(x0):
            return BreakoutFlag.DOWN

    return BreakoutFlag.NONE
cross(f, g)
判断序列f是否与g相交。如果两个序列有且仅有一个交点,则返回1表明f上交g;-1表明f下交g
本方法可用以判断两条均线是否相交。
Returns:
| Type | Description |
|---|---|
CrossFlag |
(flag, index), 其中flag取值为: 0 无效 -1 f向下交叉g 1 f向上交叉g |
Source code in omicron/talib/morph.py
def cross(f: np.ndarray, g: np.ndarray) -> CrossFlag:
    """判断序列f是否与g相交。如果两个序列有且仅有一个交点,则返回1表明f上交g;-1表明f下交g

    本方法可用以判断两条均线是否相交。

    returns:
        (flag, index), 其中flag取值为:
        0 无效
        -1 f向下交叉g
        1 f向上交叉g
    """
    indices = np.argwhere(np.diff(np.sign(f - g))).flatten()

    if len(indices) == 0:
        return CrossFlag.NONE, 0

    # 如果存在一个或者多个交点,取最后一个
    idx = indices[-1]

    if f[idx] < g[idx]:
        return CrossFlag.UPCROSS, idx
    elif f[idx] > g[idx]:
        return CrossFlag.DOWNCROSS, idx
    else:
        return CrossFlag(np.sign(g[idx - 1] - f[idx - 1])), idx
energy_hump(bars, thresh=2)
检测bars中是否存在两波以上量能剧烈增加的情形(能量驼峰),返回最后一波距现在的位置及区间长度。
注意如果最后一个能量驼峰距现在过远(比如超过10个bar),可能意味着资金已经逃离,能量已经耗尽。
Parameters:
| Name | Type | Description | Default |
|---|---|---|---|
bars |
[('frame', '<M8[s]'), ('open', '<f4'), ('high', '<f4'), ('low', '<f4'), ('close', '<f4'), ('volume', '<f8'), ('amount', '<f8'), ('factor', '<f4')] |
行情数据 |
required |
thresh |
最后一波量必须大于20天均量的倍数。 |
2 |
Returns:
| Type | Description |
|---|---|
Optional[Tuple[int, int]] |
如果不存在能量驼峰的情形,则返回None,否则返回最后一个驼峰离现在的距离及区间长度。 |
Source code in omicron/talib/morph.py
def energy_hump(bars: bars_dtype, thresh=2) -> Optional[Tuple[int, int]]:
    """检测`bars`中是否存在两波以上量能剧烈增加的情形(能量驼峰),返回最后一波距现在的位置及区间长度。

    注意如果最后一个能量驼峰距现在过远(比如超过10个bar),可能意味着资金已经逃离,能量已经耗尽。

    Args:
        bars: 行情数据
        thresh: 最后一波量必须大于20天均量的倍数。
    Returns:
        如果不存在能量驼峰的情形,则返回None,否则返回最后一个驼峰离现在的距离及区间长度。
    """
    vol = bars["volume"]

    std = np.std(vol[1:] / vol[:-1])
    pvs = peak_valley_pivots(vol, std, 0)

    frames = bars["frame"]

    pvs[0] = 0
    pvs[-1] = -1
    peaks = np.argwhere(pvs == 1)

    mn = np.mean(vol[peaks])

    # 顶点不能缩量到尖峰均值以下
    real_peaks = np.intersect1d(np.argwhere(vol > mn), peaks)

    if len(real_peaks) < 2:
        return None

    logger.debug("found %s peaks at %s", len(real_peaks), frames[real_peaks])
    lp = real_peaks[-1]
    ma = moving_average(vol, 20)[lp]
    if vol[lp] < ma * thresh:
        logger.debug(
            "vol of last peak[%s] is less than mean_vol(20) * thresh[%s]",
            vol[lp],
            ma * thresh,
        )
        return None

    return len(bars) - real_peaks[-1], real_peaks[-1] - real_peaks[0]
inverse_vcross(f, g)
判断序列f是否与序列g存在^型相交。即存在两个交点,第一个交点为向上相交,第二个交点为向下 相交。可用于判断见顶特征等场合。
Parameters:
| Name | Type | Description | Default |
|---|---|---|---|
f |
np.array |
[description] |
required |
g |
np.array |
[description] |
required |
Returns:
| Type | Description |
|---|---|
Tuple |
[description] |
Source code in omicron/talib/morph.py
def inverse_vcross(f: np.array, g: np.array) -> Tuple:
    """判断序列f是否与序列g存在^型相交。即存在两个交点,第一个交点为向上相交,第二个交点为向下
    相交。可用于判断见顶特征等场合。

    Args:
        f (np.array): [description]
        g (np.array): [description]

    Returns:
        Tuple: [description]
    """
    indices = np.argwhere(np.diff(np.sign(f - g))).flatten()
    if len(indices) == 2:
        idx0, idx1 = indices
        if f[idx0] < g[idx0] and f[idx1] > g[idx1]:
            return True, (idx0, idx1)

    return False, (None, None)
peaks_and_valleys(ts, up_thresh=None, down_thresh=None)
寻找ts中的波峰和波谷,返回数组指示在该位置上是否为波峰或波谷。如果为1,则为波峰;如果为-1,则为波谷。
本函数直接使用了zigzag中的peak_valley_pivots. 有很多方法可以实现本功能,比如scipy.signals.find_peaks_cwt, peak_valley_pivots等。本函数更适合金融时间序列,并且使用了cython加速。
Parameters:
| Name | Type | Description | Default |
|---|---|---|---|
ts |
np.ndarray |
时间序列 |
required |
up_thresh |
float |
波峰的阈值,如果为None,则使用ts变化率的二倍标准差 |
None |
down_thresh |
float |
波谷的阈值,如果为None,则使用ts变化率的二倍标准差乘以-1 |
None |
Returns:
| Type | Description |
|---|---|
np.ndarray |
返回数组指示在该位置上是否为波峰或波谷。 |
Source code in omicron/talib/morph.py
def peaks_and_valleys(
    ts: np.ndarray,
    up_thresh: Optional[float] = None,
    down_thresh: Optional[float] = None,
) -> np.ndarray:
    """寻找ts中的波峰和波谷,返回数组指示在该位置上是否为波峰或波谷。如果为1,则为波峰;如果为-1,则为波谷。

    本函数直接使用了zigzag中的peak_valley_pivots. 有很多方法可以实现本功能,比如scipy.signals.find_peaks_cwt, peak_valley_pivots等。本函数更适合金融时间序列,并且使用了cython加速。

    Args:
        ts (np.ndarray): 时间序列
        up_thresh (float): 波峰的阈值,如果为None,则使用ts变化率的二倍标准差
        down_thresh (float): 波谷的阈值,如果为None,则使用ts变化率的二倍标准差乘以-1

    Returns:
        np.ndarray: 返回数组指示在该位置上是否为波峰或波谷。
    """
    if ts.dtype != np.float64:
        ts = ts.astype(np.float64)

    if any([up_thresh is None, down_thresh is None]):
        change_rate = ts[1:] / ts[:-1] - 1
        std = np.std(change_rate)
        up_thresh = up_thresh or 2 * std
        down_thresh = down_thresh or -2 * std

    return peak_valley_pivots(ts, up_thresh, down_thresh)
plateaus(numbers, min_size, fall_in_range_ratio=0.97)
统计数组numbers中的可能存在的平台整理。
如果一个数组中存在着子数组,使得其元素与均值的距离落在三个标准差以内的比例超过fall_in_range_ratio的,则认为该子数组满足平台整理。
Parameters:
| Name | Type | Description | Default |
|---|---|---|---|
numbers |
ndarray |
输入数组 |
required |
min_size |
int |
平台的最小长度 |
required |
fall_in_range_ratio |
float |
超过 |
0.97 |
Returns:
| Type | Description |
|---|---|
List[Tuple] |
平台的起始位置和长度的数组 |
Source code in omicron/talib/morph.py
def plateaus(
    numbers: np.ndarray, min_size: int, fall_in_range_ratio: float = 0.97
) -> List[Tuple]:
    """统计数组`numbers`中的可能存在的平台整理。

    如果一个数组中存在着子数组,使得其元素与均值的距离落在三个标准差以内的比例超过`fall_in_range_ratio`的,则认为该子数组满足平台整理。

    Args:
        numbers: 输入数组
        min_size: 平台的最小长度
        fall_in_range_ratio: 超过`fall_in_range_ratio`比例的元素落在均值的三个标准差以内,就认为该子数组构成一个平台

    Returns:
        平台的起始位置和长度的数组
    """
    if numbers.size <= min_size:
        n = 1
    else:
        n = numbers.size // min_size

    clusters = clustering(numbers, n)

    plats = []
    for (start, length) in clusters:
        if length < min_size:
            continue

        y = numbers[start : start + length]
        mean = np.mean(y)
        std = np.std(y)

        inrange = len(y[np.abs(y - mean) < 3 * std])
        ratio = inrange / length

        if ratio >= fall_in_range_ratio:
            plats.append((start, length))

    return plats
rsi_bottom_distance(close, thresh=None)
根据给定的收盘价,计算最后一个数据到上一个发出rsi低水平的距离, 如果从上一个最低点rsi到最后一个数据并未发出低水平信号, 返回最后一个数据到上一个发出最低点rsi的距离。
其中close的长度一般不小于60。 返回值为距离整数,不满足条件则返回None。
Parameters:
| Name | Type | Description | Default |
|---|---|---|---|
close |
np.array |
具有时间序列的收盘价 |
required |
thresh |
Tuple[float, float]) |
None适用所有股票,不必更改,也可自行设置。 |
None |
Returns:
| Type | Description |
|---|---|
int |
返回最后一个数据到上一个发出rsi低水平的距离。 如果从上一个最低点rsi到最后一个数据并未发出低水平信号, 返回最后一个数据到上一个发出最低点rsi的距离。 除此之外,返回None。 |
Source code in omicron/talib/morph.py
def rsi_bottom_distance(close: np.array, thresh: Tuple[float, float] = None) -> int:
    """根据给定的收盘价,计算最后一个数据到上一个发出rsi低水平的距离,
    如果从上一个最低点rsi到最后一个数据并未发出低水平信号,
    返回最后一个数据到上一个发出最低点rsi的距离。

    其中close的长度一般不小于60。
    返回值为距离整数,不满足条件则返回None。

    Args:
        close (np.array): 具有时间序列的收盘价
        thresh (Tuple[float, float]) : None适用所有股票,不必更改,也可自行设置。

    Returns:
        返回最后一个数据到上一个发出rsi低水平的距离。
        如果从上一个最低点rsi到最后一个数据并未发出低水平信号,
        返回最后一个数据到上一个发出最低点rsi的距离。
        除此之外,返回None。"""

    assert len(close) >= 60, "must provide an array with at least 60 length!"

    if close.dtype != np.float64:
        close = close.astype(np.float64)

    if thresh is None:
        std = np.std(close[-59:] / close[-60:-1] - 1)
        thresh = (2 * std, -2 * std)

    rsi = ta.RSI(close, 6)

    watermarks = rsi_watermarks(close, thresh)
    if watermarks is not None:
        low_watermark, _, _ = watermarks
        pivots = peak_valley_pivots(close, thresh[0], thresh[1])
        pivots[0], pivots[-1] = 0, 0

        # 谷值RSI<30
        valley_rsi_index = np.where((rsi < 30) & (pivots == -1))[0]

        # RSI低水平的最大值:低水平*1.01
        low_rsi_index = np.where(rsi <= low_watermark * 1.01)[0]

        if len(valley_rsi_index) > 0:
            distance = len(rsi) - 1 - valley_rsi_index[-1]
            if len(low_rsi_index) > 0:
                if low_rsi_index[-1] >= valley_rsi_index[-1]:
                    distance = len(rsi) - 1 - low_rsi_index[-1]
            return distance
rsi_bottom_divergent(close, thresh=None, rsi_limit=30)
寻找最近满足条件的rsi底背离。
返回最后一个数据到最近底背离发生点的距离;没有满足条件的底背离,返回None。
Parameters:
| Name | Type | Description | Default |
|---|---|---|---|
close |
np.array |
时间序列收盘价 |
required |
thresh |
Tuple[float, float] |
None |
|
rsi_limit |
float |
RSI发生底背离时的阈值, 默认值30(20效果更佳,但是检测出来数量太少),即只过滤RSI6<30的局部最低收盘价。 |
30 |
Returns:
| Type | Description |
|---|---|
int |
返回int类型的整数,表示最后一个数据到最近底背离发生点的距离;没有满足条件的底背离,返回None。 |
Source code in omicron/talib/morph.py
def rsi_bottom_divergent(
    close: np.array, thresh: Tuple[float, float] = None, rsi_limit: float = 30
) -> int:
    """寻找最近满足条件的rsi底背离。

    返回最后一个数据到最近底背离发生点的距离;没有满足条件的底背离,返回None。

    Args:
        close (np.array): 时间序列收盘价
        thresh (Tuple[float, float]): 请参考[peaks_and_valleys][omicron.talib.morph.peaks_and_valleys]
        rsi_limit (float, optional): RSI发生底背离时的阈值, 默认值30(20效果更佳,但是检测出来数量太少),即只过滤RSI6<30的局部最低收盘价。

    Returns:
        返回int类型的整数,表示最后一个数据到最近底背离发生点的距离;没有满足条件的底背离,返回None。
    """
    assert len(close) >= 60, "must provide an array with at least 60 length!"
    if close.dtype != np.float64:
        close = close.astype(np.float64)
    rsi = ta.RSI(close, 6)

    if thresh is None:
        std = np.std(close[-59:] / close[-60:-1] - 1)
        thresh = (2 * std, -2 * std)

    pivots = peak_valley_pivots(close, thresh[0], thresh[1])
    pivots[0], pivots[-1] = 0, 0

    length = len(close)
    valley_index = np.where((pivots == -1) & (rsi <= rsi_limit))[0]

    if len(valley_index) >= 2:
        if (close[valley_index[-1]] < close[valley_index[-2]]) and (
            rsi[valley_index[-1]] > rsi[valley_index[-2]]
        ):
            bottom_dev_distance = length - 1 - valley_index[-1]

            return bottom_dev_distance
rsi_predict_price(close, thresh=None)
给定一段行情,根据最近的两个RSI的极小值和极大值预测下一个周期可能达到的最低价格和最高价格。
其原理是,以预测最近的两个最高价和最低价,求出其相对应的RSI值,求出最高价和最低价RSI的均值, 若只有一个则取最近的一个。再由RSI公式,反推价格。此时返回值为(None, float),即只有最高价,没有最低价。反之亦然。
Parameters:
| Name | Type | Description | Default |
|---|---|---|---|
close |
np.ndarray |
具有时间序列的收盘价 |
required |
thresh |
Tuple[float, float]) |
None |
Returns:
| Type | Description |
|---|---|
Tuple[float, float] |
返回数组[predicted_low_price, predicted_high_price], 数组第一个值为利用达到之前最低收盘价的RSI预测的最低价。 第二个值为利用达到之前最高收盘价的RSI预测的最高价。 |
Source code in omicron/talib/morph.py
def rsi_predict_price(
    close: np.ndarray, thresh: Tuple[float, float] = None
) -> Tuple[float, float]:
    """给定一段行情,根据最近的两个RSI的极小值和极大值预测下一个周期可能达到的最低价格和最高价格。

    其原理是,以预测最近的两个最高价和最低价,求出其相对应的RSI值,求出最高价和最低价RSI的均值,
    若只有一个则取最近的一个。再由RSI公式,反推价格。此时返回值为(None, float),即只有最高价,没有最低价。反之亦然。

    Args:
        close (np.ndarray): 具有时间序列的收盘价
        thresh (Tuple[float, float]) : 请参考[peaks_and_valleys][omicron.talib.morph.peaks_and_valleys]

    Returns:
        返回数组[predicted_low_price, predicted_high_price], 数组第一个值为利用达到之前最低收盘价的RSI预测的最低价。
        第二个值为利用达到之前最高收盘价的RSI预测的最高价。
    """
    assert len(close) >= 60, "must provide an array with at least 60 length!"

    if thresh is None:
        std = np.std(close[-59:] / close[-60:-1] - 1)
        thresh = (2 * std, -2 * std)

    if close.dtype != np.float64:
        close = close.astype(np.float64)

    valley_rsi, peak_rsi, _ = rsi_watermarks(close, thresh=thresh)
    pivot = peak_valley_pivots(close, thresh[0], thresh[1])
    pivot[0], pivot[-1] = 0, 0  # 掐头去尾

    price_change = pd.Series(close).diff(1).values
    ave_price_change = (abs(price_change)[-6:].mean()) * 5
    ave_price_raise = (np.maximum(price_change, 0)[-6:].mean()) * 5

    if valley_rsi is not None:
        predicted_low_change = (ave_price_change) - ave_price_raise / (
            0.01 * valley_rsi
        )
        if predicted_low_change > 0:
            predicted_low_change = 0
        predicted_low_price = close[-1] + predicted_low_change
    else:
        predicted_low_price = None

    if peak_rsi is not None:
        predicted_high_change = (ave_price_raise - ave_price_change) / (
            0.01 * peak_rsi - 1
        ) - ave_price_change
        if predicted_high_change < 0:
            predicted_high_change = 0
        predicted_high_price = close[-1] + predicted_high_change
    else:
        predicted_high_price = None

    return predicted_low_price, predicted_high_price
rsi_top_distance(close, thresh=None)
根据给定的收盘价,计算最后一个数据到上一个发出rsi高水平的距离, 如果从上一个最高点rsi到最后一个数据并未发出高水平信号, 返回最后一个数据到上一个发出最高点rsi的距离。
其中close的长度一般不小于60。 返回值为距离整数,不满足条件则返回None。
Parameters:
| Name | Type | Description | Default |
|---|---|---|---|
close |
np.array |
具有时间序列的收盘价 |
required |
thresh |
Tuple[float, float]) |
None适用所有股票,不必更改,也可自行设置。 |
None |
Returns:
| Type | Description |
|---|---|
int |
返回最后一个数据到上一个发出rsi高水平的距离。 如果从上一个最高点rsi到最后一个数据并未发出高水平信号, 返回最后一个数据到上一个发出最高点rsi的距离。 除此之外,返回None。 |
Source code in omicron/talib/morph.py
def rsi_top_distance(close: np.array, thresh: Tuple[float, float] = None) -> int:
    """根据给定的收盘价,计算最后一个数据到上一个发出rsi高水平的距离,
    如果从上一个最高点rsi到最后一个数据并未发出高水平信号,
    返回最后一个数据到上一个发出最高点rsi的距离。

    其中close的长度一般不小于60。
    返回值为距离整数,不满足条件则返回None。

    Args:
        close (np.array): 具有时间序列的收盘价
        thresh (Tuple[float, float]) : None适用所有股票,不必更改,也可自行设置。

    Returns:
        返回最后一个数据到上一个发出rsi高水平的距离。
        如果从上一个最高点rsi到最后一个数据并未发出高水平信号,
        返回最后一个数据到上一个发出最高点rsi的距离。
        除此之外,返回None。"""

    assert len(close) >= 60, "must provide an array with at least 60 length!"

    if close.dtype != np.float64:
        close = close.astype(np.float64)

    if thresh is None:
        std = np.std(close[-59:] / close[-60:-1] - 1)
        thresh = (2 * std, -2 * std)

    rsi = ta.RSI(close, 6)

    watermarks = rsi_watermarks(close, thresh)
    if watermarks is not None:
        _, high_watermark, _ = watermarks
        pivots = peak_valley_pivots(close, thresh[0], thresh[1])
        pivots[0], pivots[-1] = 0, 0

        # 峰值RSI>70
        peak_rsi_index = np.where((rsi > 70) & (pivots == 1))[0]

        # RSI高水平的最小值:高水平*0.99
        high_rsi_index = np.where(rsi >= high_watermark * 0.99)[0]

        if len(peak_rsi_index) > 0:
            distance = len(rsi) - 1 - peak_rsi_index[-1]
            if len(high_rsi_index) > 0:
                if high_rsi_index[-1] >= peak_rsi_index[-1]:
                    distance = len(rsi) - 1 - high_rsi_index[-1]
            return distance
rsi_top_divergent(close, thresh=None, rsi_limit=70)
寻找最近满足条件的rsi顶背离。
返回最后一个数据到最近顶背离发生点的距离;没有满足条件的顶背离,返回None。
Parameters:
| Name | Type | Description | Default |
|---|---|---|---|
close |
np.array |
时间序列收盘价 |
required |
thresh |
Tuple[float, float] |
None |
|
rsi_limit |
float |
RSI发生顶背离时的阈值, 默认值70(80效果更佳,但是检测出来数量太少),即只过滤RSI6>70的局部最高收盘价。 |
70 |
Returns:
| Type | Description |
|---|---|
Tuple[int, int] |
返回int类型的整数,表示最后一个数据到最近顶背离发生点的距离;没有满足条件的顶背离,返回None。 |
Source code in omicron/talib/morph.py
def rsi_top_divergent(
    close: np.array, thresh: Tuple[float, float] = None, rsi_limit: float = 70
) -> Tuple[int, int]:
    """寻找最近满足条件的rsi顶背离。

    返回最后一个数据到最近顶背离发生点的距离;没有满足条件的顶背离,返回None。

    Args:
        close (np.array): 时间序列收盘价
        thresh (Tuple[float, float]): 请参考[peaks_and_valleys][omicron.talib.morph.peaks_and_valleys]
        rsi_limit (float, optional): RSI发生顶背离时的阈值, 默认值70(80效果更佳,但是检测出来数量太少),即只过滤RSI6>70的局部最高收盘价。

    Returns:
        返回int类型的整数,表示最后一个数据到最近顶背离发生点的距离;没有满足条件的顶背离,返回None。
    """
    assert len(close) >= 60, "must provide an array with at least 60 length!"
    if close.dtype != np.float64:
        close = close.astype(np.float64)
    rsi = ta.RSI(close, 6)

    if thresh is None:
        std = np.std(close[-59:] / close[-60:-1] - 1)
        thresh = (2 * std, -2 * std)

    pivots = peak_valley_pivots(close, thresh[0], thresh[1])
    pivots[0], pivots[-1] = 0, 0

    length = len(close)
    peak_index = np.where((pivots == 1) & (rsi >= rsi_limit))[0]

    if len(peak_index) >= 2:
        if (close[peak_index[-1]] > close[peak_index[-2]]) and (
            rsi[peak_index[-1]] < rsi[peak_index[-2]]
        ):
            top_dev_distance = length - 1 - peak_index[-1]

            return top_dev_distance
rsi_watermarks(close, thresh=None)
给定一段行情数据和用以检测顶和底的阈值,返回该段行情中,谷和峰处RSI均值,最后一个RSI6值。
其中close的长度一般不小于60,不大于120。返回值中,一个为low_wartermark(谷底处RSI值), 一个为high_wartermark(高峰处RSI值),一个为RSI6的最后一个值,用以对比前两个警戒值。
Parameters:
| Name | Type | Description | Default |
|---|---|---|---|
close |
np.array |
具有时间序列的收盘价 |
required |
thresh |
Tuple[float, float]) |
None适用所有股票,不必更改,也可自行设置。 |
None |
Returns:
| Type | Description |
|---|---|
Tuple[float, float, float] |
返回数组[low_watermark, high_watermark, rsi[-1]], 第一个为最近两个最低收盘价的RSI均值, 第二个为最近两个最高收盘价的RSI均值。 若传入收盘价只有一个最值,只返回一个。没有最值,则返回None, 第三个为实际的最后RSI6的值。 |
Source code in omicron/talib/morph.py
def rsi_watermarks(
    close: np.array, thresh: Tuple[float, float] = None
) -> Tuple[float, float, float]:
    """给定一段行情数据和用以检测顶和底的阈值,返回该段行情中,谷和峰处RSI均值,最后一个RSI6值。

    其中close的长度一般不小于60,不大于120。返回值中,一个为low_wartermark(谷底处RSI值),
    一个为high_wartermark(高峰处RSI值),一个为RSI6的最后一个值,用以对比前两个警戒值。

    Args:
        close (np.array): 具有时间序列的收盘价
        thresh (Tuple[float, float]) : None适用所有股票,不必更改,也可自行设置。

    Returns:
        返回数组[low_watermark, high_watermark, rsi[-1]], 第一个为最近两个最低收盘价的RSI均值, 第二个为最近两个最高收盘价的RSI均值。
        若传入收盘价只有一个最值,只返回一个。没有最值,则返回None, 第三个为实际的最后RSI6的值。
    """
    assert len(close) >= 60, "must provide an array with at least 60 length!"

    if thresh is None:
        std = np.std(close[-59:] / close[-60:-1] - 1)
        thresh = (2 * std, -2 * std)

    if close.dtype != np.float64:
        close = close.astype(np.float64)
    rsi = ta.RSI(close, 6)

    pivots = peak_valley_pivots(close, thresh[0], thresh[1])
    pivots[0], pivots[-1] = 0, 0  # 掐头去尾

    # 峰值RSI>70; 谷处的RSI<30;
    peaks_rsi_index = np.where((rsi > 70) & (pivots == 1))[0]
    valleys_rsi_index = np.where((rsi < 30) & (pivots == -1))[0]

    if len(peaks_rsi_index) == 0:
        high_watermark = None
    elif len(peaks_rsi_index) == 1:
        high_watermark = rsi[peaks_rsi_index[0]]
    else:  # 有两个以上的峰,通过最近的两个峰均值来确定走势
        high_watermark = np.nanmean(rsi[peaks_rsi_index[-2:]])

    if len(valleys_rsi_index) == 0:
        low_watermark = None
    elif len(valleys_rsi_index) == 1:
        low_watermark = rsi[valleys_rsi_index[0]]
    else:  # 有两个以上的峰,通过最近的两个峰来确定走势
        low_watermark = np.nanmean(rsi[valleys_rsi_index[-2:]])

    return low_watermark, high_watermark, rsi[-1]
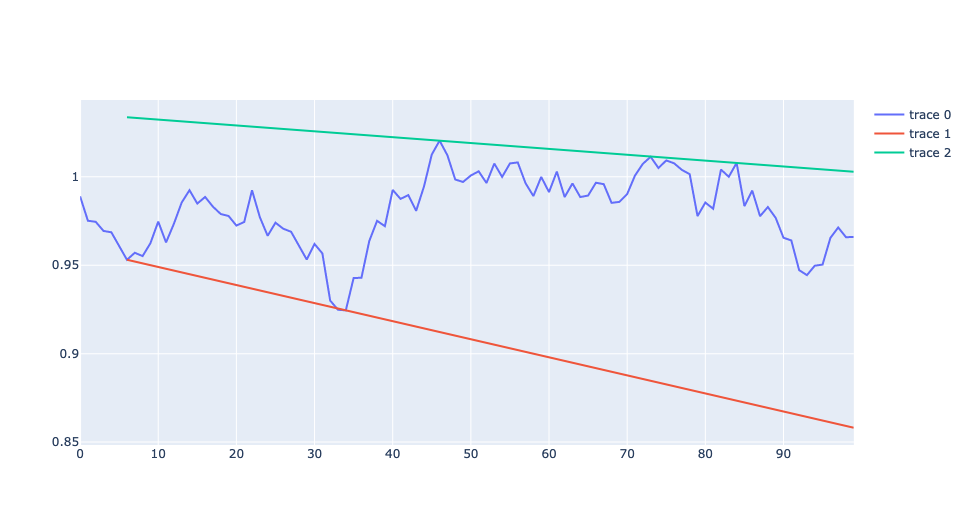
support_resist_lines(ts, upthres=None, downthres=None)
计算时间序列的支撑线和阻力线
使用最近的两个高点连接成阴力线,两个低点连接成支撑线。
Examples:
1 2 3 4 5 6 7 8 9 10 11 12 13 14 15 16 17 | |
Parameters:
| Name | Type | Description | Default |
|---|---|---|---|
ts |
np.ndarray |
时间序列 |
required |
upthres |
float |
None |
|
downthres |
float |
None |
Returns:
| Type | Description |
|---|---|
Tuple[Callable, Callable, numpy.ndarray] |
返回支撑线和阻力线的计算函数及起始点坐标,如果没有支撑线或阻力线,则返回None |
Source code in omicron/talib/morph.py
def support_resist_lines(
ts: np.ndarray, upthres: float = None, downthres: float = None
) -> Tuple[Callable, Callable, np.ndarray]:
"""计算时间序列的支撑线和阻力线
使用最近的两个高点连接成阴力线,两个低点连接成支撑线。
Examples:
```python
    def show_support_resist_lines(ts):
        import plotly.graph_objects as go

        fig = go.Figure()

        support, resist, x_start = support_resist_lines(ts, 0.03, -0.03)
        fig.add_trace(go.Scatter(x=np.arange(len(ts)), y=ts))

        x = np.arange(len(ts))[x_start:]
        fig.add_trace(go.Line(x=x, y = support(x)))
        fig.add_trace(go.Line(x=x, y = resist(x)))

        fig.show()

    np.random.seed(1978)
    X = np.cumprod(1 + np.random.randn(100) * 0.01)
    show_support_resist_lines(X)
```
the above code will show this 
Args:
ts (np.ndarray): 时间序列
upthres (float, optional): 请参考[peaks_and_valleys][omicron.talib.morph.peaks_and_valleys]
downthres (float, optional): 请参考[peaks_and_valleys][omicron.talib.morph.peaks_and_valleys]
Returns:
返回支撑线和阻力线的计算函数及起始点坐标,如果没有支撑线或阻力线,则返回None
"""
if ts.dtype != np.float64:
ts = ts.astype(np.float64)
pivots = peaks_and_valleys(ts, upthres, downthres)
pivots[0] = 0
pivots[-1] = 0
arg_max = np.argwhere(pivots == 1).flatten()
arg_min = np.argwhere(pivots == -1).flatten()
resist = None
support = None
if len(arg_max) >= 2:
arg_max = arg_max[-2:]
y = ts[arg_max]
coeff = np.polyfit(arg_max, y, deg=1)
resist = np.poly1d(coeff)
if len(arg_min) >= 2:
arg_min = arg_min[-2:]
y = ts[arg_min]
coeff = np.polyfit(arg_min, y, deg=1)
support = np.poly1d(coeff)
return support, resist, np.min([*arg_min, *arg_max])
valley_detect(close, thresh=(0.05, -0.02))
给定一段行情数据和用以检测近期已发生反转的最低点,返回该段行情中,最低点到最后一个数据的距离和收益率数组, 如果给定行情中未找到满足参数的最低点,则返回两个空值数组。
其中bars的长度一般不小于60,不大于120。此函数采用了zigzag中的谷峰检测方法,其中参数默认(0.05,-0.02), 此参数对所有股票数据都适用。若满足参数,返回值中,距离为大于0的整数,收益率是0~1的小数。
Parameters:
| Name | Type | Description | Default |
|---|---|---|---|
close |
np.ndarray |
具有时间序列的收盘价 |
required |
thresh |
Tuple[float, float]) |
(0.05, -0.02) |
Returns:
| Type | Description |
|---|---|
int |
返回该段行情中,最低点到最后一个数据的距离和收益率数组, 如果给定行情中未找到满足参数的最低点,则返回两个空值数组。 |
Source code in omicron/talib/morph.py
def valley_detect(
    close: np.ndarray, thresh: Tuple[float, float] = (0.05, -0.02)
) -> int:
    """给定一段行情数据和用以检测近期已发生反转的最低点,返回该段行情中,最低点到最后一个数据的距离和收益率数组,
    如果给定行情中未找到满足参数的最低点,则返回两个空值数组。

    其中bars的长度一般不小于60,不大于120。此函数采用了zigzag中的谷峰检测方法,其中参数默认(0.05,-0.02),
    此参数对所有股票数据都适用。若满足参数,返回值中,距离为大于0的整数,收益率是0~1的小数。

    Args:
        close (np.ndarray): 具有时间序列的收盘价
        thresh (Tuple[float, float]) : 请参考[peaks_and_valleys][omicron.talib.morph.peaks_and_valleys]

    Returns:
        返回该段行情中,最低点到最后一个数据的距离和收益率数组,
        如果给定行情中未找到满足参数的最低点,则返回两个空值数组。
    """

    assert len(close) >= 60, "must provide an array with at least 60 length!"

    if close.dtype != np.float64:
        close = close.astype(np.float64)

    if thresh is None:
        std = np.std(close[-59:] / close[-60:-1] - 1)
        thresh = (2 * std, -2 * std)

    pivots = peak_valley_pivots(close, thresh[0], thresh[1])
    flags = pivots[pivots != 0]
    increased = None
    lowest_distance = None
    if (flags[-2] == -1) and (flags[-1] == 1):
        length = len(pivots)
        valley_index = np.where(pivots == -1)[0]
        increased = (close[-1] - close[valley_index[-1]]) / close[valley_index[-1]]
        lowest_distance = int(length - 1 - valley_index[-1])

    return lowest_distance, increased
vcross(f, g)
判断序列f是否与g存在类型v型的相交。即存在两个交点,第一个交点为向下相交,第二个交点为向上 相交。一般反映为洗盘拉升的特征。
Examples:
>>> f = np.array([ 3 * i ** 2 - 20 * i +  2 for i in range(10)])
>>> g = np.array([ i - 5 for i in range(10)])
>>> flag, indices = vcross(f, g)
>>> assert flag is True
>>> assert indices[0] == 0
>>> assert indices[1] == 6
Parameters:
| Name | Type | Description | Default |
|---|---|---|---|
f |
<built-in function array> |
first sequence |
required |
g |
<built-in function array> |
the second sequence |
required |
Returns:
| Type | Description |
|---|---|
Tuple |
(flag, indices), 其中flag取值为True时,存在vcross,indices为交点的索引。 |
Source code in omicron/talib/morph.py
def vcross(f: np.array, g: np.array) -> Tuple:
    """判断序列f是否与g存在类型v型的相交。即存在两个交点,第一个交点为向下相交,第二个交点为向上
    相交。一般反映为洗盘拉升的特征。

    Examples:

        >>> f = np.array([ 3 * i ** 2 - 20 * i +  2 for i in range(10)])
        >>> g = np.array([ i - 5 for i in range(10)])
        >>> flag, indices = vcross(f, g)
        >>> assert flag is True
        >>> assert indices[0] == 0
        >>> assert indices[1] == 6

    Args:
        f: first sequence
        g: the second sequence

    Returns:
        (flag, indices), 其中flag取值为True时,存在vcross,indices为交点的索引。
    """
    indices = np.argwhere(np.diff(np.sign(f - g))).flatten()
    if len(indices) == 2:
        idx0, idx1 = indices
        if f[idx0] > g[idx0] and f[idx1] < g[idx1]:
            return True, (idx0, idx1)

    return False, (None, None)